Analytics Reveal Patterns in Player Funding Choices for Virtual Casinos
David Patterson · Aug 7, 2026

Analytics Reveal Patterns in Player Funding Choices for Virtual Casinos
Analytics platforms now track every step players take when selecting instant funding options inside virtual casino environments, and the resulting datasets show clear preferences that have emerged across multiple regions since early 2025. Payment speed ranks highest in user logs, followed closely by transaction fees and security certifications that appear in session recordings. Researchers at institutions tracking digital gambling behavior note that these three factors consistently appear together in decision trees built from millions of deposit events.
Data Sources Driving Current Insights
Transaction records from major operators feed into aggregated reports that break down funding choices by time of day, device type, and geographic location. Figures from North American regulators such as the Nevada Gaming Control Board indicate that mobile sessions account for over seventy percent of instant deposits processed during peak evening hours. Similar patterns surface in European operator data where e-wallet selections rise sharply on weekends. Observers note that these regional datasets align when normalized for population size, which allows analysts to identify universal trends rather than market-specific quirks.
Payment Method Preferences Among Different User Groups
Breakdowns by age reveal that users between twenty-five and thirty-four years old complete instant funding steps fastest when digital wallets appear as the default option. Older cohorts show higher selection rates for bank transfer methods even when slower processing times are displayed upfront. Gender splits remain minimal in overall volume yet surface in preferred authentication flows, with female users more frequently opting for methods that include biometric confirmation steps. These distinctions emerge from clickstream analysis rather than self-reported surveys, giving operators precise visibility into actual behavior during live sessions.
Speed Versus Cost Trade-offs in Real Time
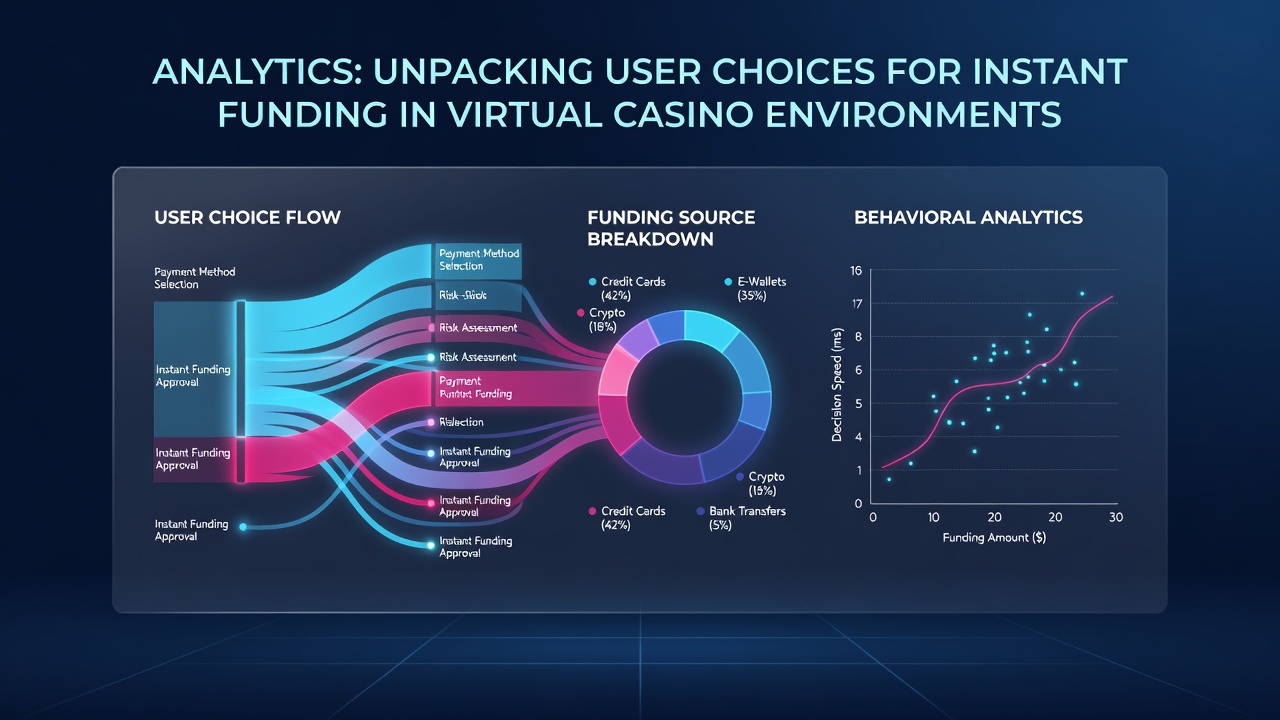
Heat maps generated from A/B testing show that players abandon funding flows at higher rates once estimated completion times exceed ninety seconds, even when the method carries lower fees. Conversely, selections spike when instant options carry small surcharges under two percent. This pattern held steady through mid-2026, including data captured during August when summer promotions temporarily altered fee structures across several platforms. The evidence suggests users treat time savings as a premium service worth a modest markup rather than seeking the absolute cheapest route every time.
Geographic and Regulatory Influences on Choices
Operators serving Australian markets report elevated use of instant bank transfer services following updates to local consumer protection rules that emphasize transaction transparency. In contrast, Canadian provincial data highlight continued reliance on prepaid voucher systems in regions where credit card restrictions remain in place. These differences illustrate how regulatory environments shape the menu of instant options presented to users, which in turn affects which choices analytics ultimately record as most popular. Industry reports from bodies such as the Australian Communications and Media Authority further confirm that disclosure requirements around processing times directly influence selection rates.
Retention Effects Linked to Funding Friction
Longitudinal studies tracking the same user cohorts over twelve months demonstrate that players who encounter fewer than two failed funding attempts within their first week show markedly higher return rates thirty days later. Analytics dashboards flag repeated authentication errors as early churn indicators, prompting operators to surface alternative instant methods before users exit the deposit screen. One study released by researchers at the University of Sydney found that simplifying the verification layer increased successful first-time deposits by eighteen percent across the sampled platforms. Those results align with operator logs that link reduced friction at the funding stage to longer overall session durations and higher lifetime value metrics.
Emerging Tools for Deeper Behavioral Analysis
Machine learning models now segment users not only by funding method but by the sequence of actions leading to each choice, such as whether players compare multiple options or proceed directly to the fastest available route. These sequence models help predict which instant methods will gain traction when new providers enter the market. Data collected through August 2026 already shows early adoption curves for newer real-time rail systems in markets where traditional cards face processing caps. Analysts expect these curves to steepen as more operators integrate the latest instant rails into their default checkout flows.
Conclusion
Analytics continue to map the precise decision pathways players follow when choosing instant funding inside virtual casino environments, delivering operators granular visibility into speed, cost, and security priorities that vary by demographic and regulatory context. The datasets accumulated through 2026 underscore that friction reduction at the deposit stage correlates strongly with sustained engagement across regions. As new instant rails and authentication methods appear, ongoing analysis will track how those innovations shift the existing preference hierarchies documented in current reports.